An important part of what makes social network analysis so fascinating to broad audiences is the possibility of visualization of networks. You can already learn a lot about the structure of a network simply by looking at a picture (although the choice of the ‘right’ picture is no trivial thing), and they can be esthetically pleasing, too. Specialized software packages like Pajek offer great tools for network visualization, but if you are working with Stata, having to export your data to Pajek for every simple picture is a pain.
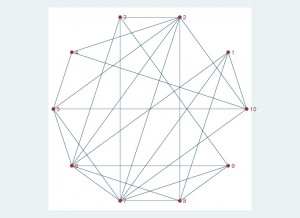
My Stata program netplot is a first* step to making network visualization available within Stata. Assuming that you have data stored as edges or arcs, the program lets you draw plots of your network, using multi-dimensional scaling to determine the placement of the nodes. Alternatively, you can have your nodes arranged on a circle. The use of labels to identify nodes in the graph is also supported.
Below are some examples:
//create a random network with 10 nodes
//(code adopted from the helpfile of stata2pajek)
clear
set obs 200
gen i=int(uniform()*10)+1
gen j=int(uniform()*10)+1
contract i j, freq(strength)
drop if i==j
sort i j
drop if strength <3 // --> keep only the "stronger" links

// Draw the network
netplot i j

// Draw with labels
netplot i j, label

// Use a circle layout
netplot i j, type(circle) label

I admit that multidimensional scaling is not the most fancy node placement algorithm around (see this article by Freeman for an overview of available techniques), but the good thing about it is that the procedure is already included in Stata by default. Getting actually nice graphs with Netplot might take a few trials, but it’s a start. To install, type ssc install netplot. More details and other examples are provided in this working paper. [UPATE: the paper has by now been published in the Stata Journal. Get it here.]
Awesome! Thanks this is very impressive
hannah